
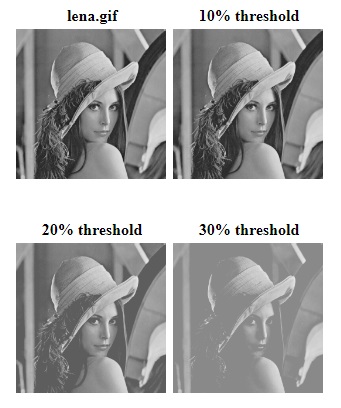
This program show the effect of thresholding. The output are four subfigures shown in the same figure:
The MATLAB codes:
%%%%%%%%%%%%% The main.m file %%%%%%%%%%%%%%
clear;
% Threshold level parameter alfa:
alfa=0.1;% less than 1/3
[x,map]=gifread('lena.gif');
ix=ind2gray(x,map);
I_max=max(max(ix));
I_min=min(min(ix));
level1=alfa*(I_max-I_min)+I_min;
level2=2*level1;
level3=3*level1;
thix1=max(ix,level1.*ones(size(ix)));
thix2=max(ix,level2.*ones(size(ix)));
thix3=max(ix,level3.*ones(size(ix)));
figure(1);colormap(gray);
subplot(2,2,1);imagesc(ix);title('lena');
subplot(2,2,2);imagesc(thix1);title('threshold one alfa');
subplot(2,2,3);imagesc(thix2);title('threshold two alfa');
subplot(2,2,4);imagesc(thix3);title('threshold three alfa');
%%%%%%%%%%%%% End of the main.m file %%%%%%%%%%%%%%
OUTPUT
Contact:
Mr. Roshan P. Helonde
Mobile: +91-7276355704
WhatsApp: +91-7276355704
Email: roshanphelonde@rediffmail.com


.png)


